JMeter
Table of contents
Performance Test의 세가지 메인 팩터
- Speed - If the response of the application is fast or not
- Scalability - The maximum user load is determined
- Stability - The application is checked under varying loads
Type of Testing
Load Testing
Load testingis a type in which it tests an application for its performance at normal and peak usage. The performance is checked as per the response time and consistency on different user loads.Volume Testing
Volume testingis a type where the system’s performance is checked concerning the volume of data. To perform the test, it enters a vast amount of data into the database.Stress Testing
Stress testingis a type in which different ways to break the system are found, i.e., how much load a system can sustain. It checks how much load a system can hold in an incremental approach.Capacity Testing
Capacity testingis a type in which it checks an application for its capability to meet business volumes. The testing is performed, keeping in mind the prospects of an application and the number of users.Reliability Testing
Reliability testingis when the application is verified if the application would become normal again after an abnormal state. It estimates the tim`e that the system would take to return to its normal state.Scalability Testing
Scalability testingis a type where the application is determined if it could scale up whenever needed. The need for scaling up comes when there is an increase in user load.
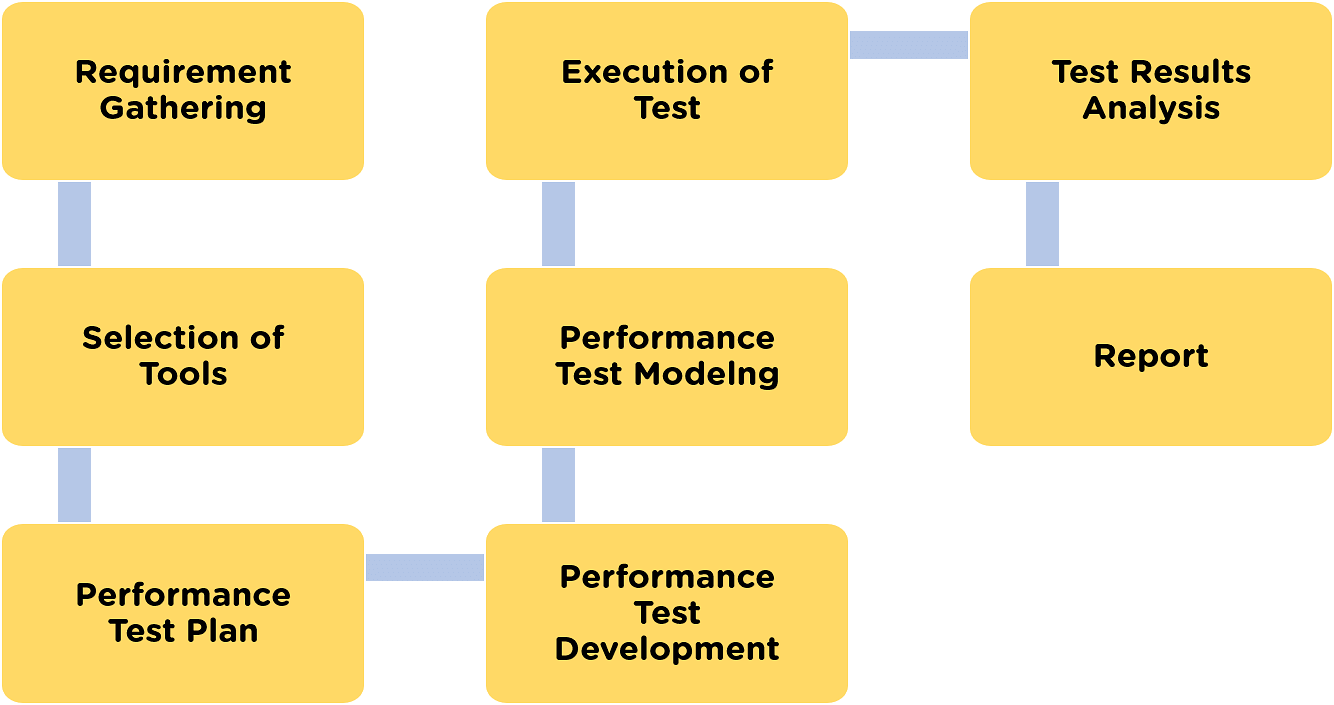
Requirement Gathering
The requirements are identified and gathered from the clients. The information on the application’s infrastructure, functionality, and usage is gathered.Selection of ToolsAfter the analysis is complete, it performs proof of concept with the available tools. The available tools list depends on the tool cost and the technology used.Performance Test PlanAfter the above steps, test planning and designing are done. It is the test plan that decides how the performance test will take place.Performance Test DevelopmentHere, the use cases for the identified functionalities are created. Once the clients approve the use case, the script development begins. These scripts are then validated, and parallelly the test environment is set up.Performance Test ModelingHere the performance load model is created for test execution. It is checked if they achieve the performance metrics provided by the clients.Execution of TestInitially, the tests are not executed with maximum users that are in the Load model. It does the text execution in incremental order.Test Results AnalysisResults are the most important deliverable for performance testing. Here, the ROI and productivity that performance testing may provide are shown.ReportAt the end of all the steps, it is necessary to have a simplified conclusion A brief, descriptive, and to-the-point test report is made.
Performance Testing Metrics
Processor Usage: Time spent by the processor to execute non-idle threads. Memory use: The available physical memory to process on a system. Disk time: It is the time taken by the disk to read or write a request. Bandwidth: Bits per second used by a network interface. Private bytes: A specific number of bytes allocated to a particular process. Committed memory: The amount of virtual memory used. Response time: Time between the user’s request and the first response character. Throughput: Rate of requests received per second by a network. Hit ratios: Number of SQL statements that are handled by cached data. Top waits: Monitoring of the wait times that could be cut. CPU interrupts per second: Average number of interruptions that a processor receives and processes each second. Maximum active sessions: Maximum number of sessions that may stay active at once. Thread counts: Determining the well-being of the application by checking the number of running and active threads. Disk queue length: Average number of read and write requests that are queued for a sample interview. Garbage collection: Returning the memory to the unused system, which helps in monitoring the efficiency.
In My Case
- Load Testing : Multiple User 동시 접속s
- Stress Testing : maximum load capa
Number of Threads: 100 (Number of users connects to the target website: 100) (여러유저 동시접속) Loop Count: 10 (Number of time to execute testing) (한 유저 여러번 접속) Ramp-Up Period: 100 (Thread를 전부 생성하는데 걸리는 시간)
Top 5 JMeter Plugins
https://www.softwaretestinghelp.com/jmeter-plugins/
Plugins Manager: 62109 Custom Thread Groups: 36269 3 Basic Graphs: 33815 PerfMon (Servers Performance Monitoring): 24899 Dummy Sampler: 24024 Throughput Shaping Timer: 22393 Custom JMeter Functions: 21651 Flexible File Writer: 18967 5 Additional Graphs: 18952 Inter-Thread Communication: 18385